
[Trigger Warning]
If you have reached this page, presumably you have seen my book, Life: It Sucks Sometimes. I apologize, I know that must have been a bit of a bummer. If it helped you, I am sincerely grateful to hear that. If that healthy dose of sadness wasn’t enough for you though, I’ve included some content below to satisfy that itch. Below are some line graphs to correspond with my book. I figured using smooth line graphs would match the path along which the physical book takes place. “Board Game Path Inspired by Mental Illness” meets “Mathematics Based Path Inspired by Mental Illness”.Pretty neat, huh? That’s right, not only does the book incorporate chronic depression and ruining childhood games, it also features statistics and Microsoft Excel. Please, try to contain your excitement.
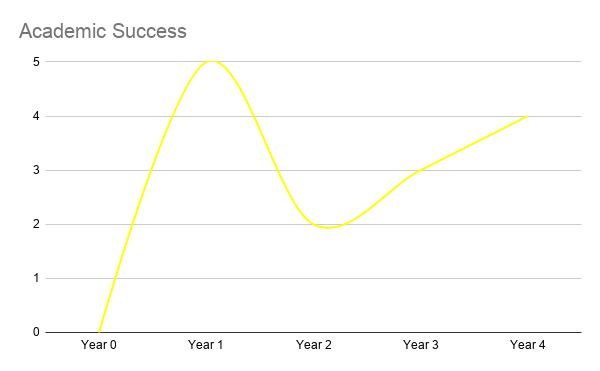
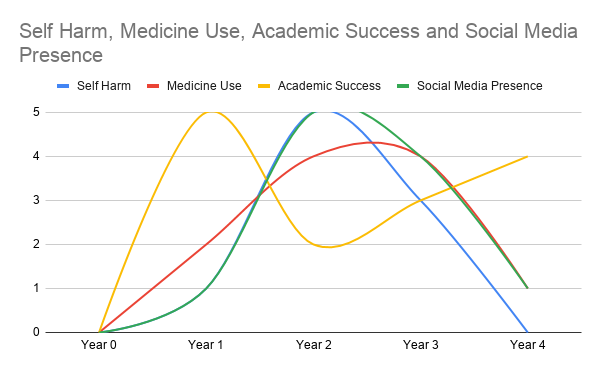
To preface these graphs, I’ll go over some quick things to note. Each of them uses a 1 to 5 scale, 5 being the highest, 1 being the lowest. For example, in the graph below, the highest peak is at year 1, where my Academic Success rating is at a 5. This means that in year 1, this was my best year at school. Pretty straight forward, yeah? Good. Next, you might be confused as to why the graphs start at “year zero”. This was just the easiest way to make each line start at the same point. I apologize if this is not traditional statistical protocol, I just wanted to make an aesthetically pleasing depression graph for you guys. Don’t flood my mailbox with hate letters, I’m trying my damn best.
The purpose of showing these graphs and their varying paths is to show that your journey with mental illness is an unpredictable one. It will take you places you aren’t prepared for, places that will challenge you in ways that words would fail to describe. But no matter how far downhill you go, you’re only building momentum to shoot right back upwards again. I’ve never been fond of the “why are we here” debate, especially in college, because everybody is desperate to prove how smart they are that the conversation becomes increasingly cringeworthy and annoying. However, if I were to provide an honest opinion as to ” why we’re here”, I would say that our purpose is simply to grow. All we can do is grow, and when it comes to mental illness growth is the best thing you can strive for. Unfortunately, there are no cures for the things people like me suffer from. The best we can do is learn, persevere, and grow. Never, ever give up, no matter how hard things may seem. If you reach out, in every direction as far as you can, eventually you’ll find the hand that lifts you up. We all eventually get to where we are supposed to be. For some that journey is longer than others, but it’s all worth it in the end. Persevere, my friends. Never stop trying. Your story isn’t over yet. Your journey is just beginning. Keep growing.
National Suicide Prevention Hotline- 1-800-273-8255
Follow this hyperlink to read Anonymous’s project statement.